The Hidden Math of Your Job Search:
To navigate the job market effectively, you need to understand the financial machinery operating behind the "Apply" button. The numbers from the Naukri portal (April 2025 – March 2026) reveal a high-stakes cycle of spending that impacts every applicant.
 The Competition Landscape
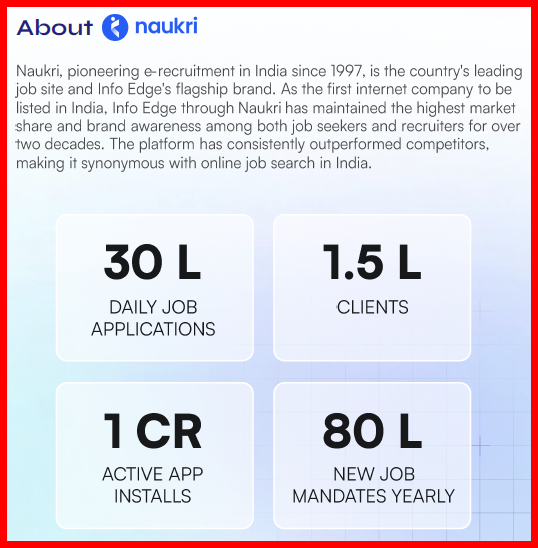
- The Daily Hustle: 30 lakh applicants are active daily.
- The Volume: 1.5 lakh clients post 80+ lakh opportunities annually.
- The Result: Only about 16.68 lakh people actually landed jobs through the portal last year.
This means that despite the millions of postings, the "success rate" via the portal is tighter than it looks.
The ₹3,352 Crore "Middleman" Tax
Info Edge (NAUKRI.NS) generated ₹3,352 crore in revenue last year. This money didn't go to employee salaries or recruiter commissions; it was the cost paid by companies simply to use the platform.
- Per-Hire Cost: Employers spend ₹20,093 in portal fees for every successful hire.
- The Turnover Penalty: If a hire leaves and is replaced three times in a year, the employer loses ₹60,279 just to the platform.
The Reality for the Candidate
The average salary in India is approximately ₹9,28,000.
When you see these numbers, the takeaway isn't that the system "values" you—it’s that the system is expensive and volatile. For a serious candidate, this data highlights two critical truths:
- The Budget Drain: Every rupee a company spends on "portal fees" and "attrition costs" is a rupee they aren't spending on your base pay or benefits.
- The "Jump" Trap: While jumping jobs might seem like the only way to increase your pay, the high cost of recruitment makes employers increasingly wary of "frequent switchers" who represent a ₹60,000+ sunk cost in platform fees alone.
The Bottom Line: You are entering a market where companies are spending heavily to manage churn. Understanding this "hiring tax" helps you see why the process is so rigid?
Why "Just Applying" Is a Losing Strategy
If you aren't putting in the effort to prove your long-term value, you are just another "unit" in a ₹3,352 crore transaction. In a market this expensive, "easy" applications lead to "easy" rejections. To land a sustainable job, you must prove you are worth the investment that the company is currently losing to the portal.
Here are the hard numbers to open your eyes if you think simply applying (without putting efforts) may land you upon a lucrative sustainable job.
Total hiring in 25-26 via Naukri Portal
| # | Industry | Mar'25 | YOY % | Apr 25 To Mar 26 Total | Apr'25 | May'25 | Jun'25 | Jul'25 | Aug'25 | Sep'25 | Oct'25 | Nov'25 | Dec'25 | Jan'26 | Feb'26 | Mar'26 |
| 1 | Defence/Government | 9646 | ↑1% | 117,708 | 9433 | 8921 | 9679 | 9007 | 9786 | 10843 | 8730 | 9587 | 10413 | 10761 | 10818 | 9730 |
| 2 | Accounting/Finance | 5926 | ↑53% | 95,255 | 7218 | 6502 | 6989 | 7947 | 7456 | 8329 | 6658 | 8975 | 9121 | 7556 | 9449 | 9055 |
| 3 | Gems & Jewellery | 5989 | ↑24% | 86,091 | 6554 | 7140 | 6581 | 6993 | 6750 | 7119 | 6296 | 8140 | 8257 | 6829 | 8023 | 7409 |
| 4 | Medical/Healthcare/Hospital | 6019 | ↑8% | 78,002 | 6266 | 6338 | 6364 | 6632 | 5845 | 6995 | 5771 | 7164 | 6990 | 6217 | 6948 | 6472 |
| 5 | Fertilizers/Pesticides | 5920 | ↓12% | 71,893 | 6528 | 6521 | 6534 | 6305 | 6063 | 6325 | 5292 | 6352 | 5439 | 5225 | 6121 | 5188 |
| 6 | Semiconductors/Electronics | 5290 | ↓3% | 64,729 | 5646 | 5805 | 5584 | 6184 | 5362 | 5588 | 4461 | 5475 | 5414 | 4657 | 5432 | 5121 |
| 7 | Advertising/PR/MR/Events | 4522 | ↑26% | 64,641 | 4885 | 4794 | 5149 | 5322 | 5091 | 5536 | 4782 | 5890 | 5774 | 5530 | 6172 | 5716 |
| 8 | Education/Teaching/Training | 4420 | ↑15% | 62,352 | 5044 | 4994 | 5020 | 5515 | 4945 | 5357 | 4831 | 5973 | 5345 | 4733 | 5532 | 5063 |
| 9 | Legal | 5786 | ↓17% | 61,999 | 5762 | 5443 | 5148 | 6004 | 5191 | 5600 | 4554 | 4897 | 4978 | 4091 | 5515 | 4816 |
| 10 | Office Equipment/Automation | 3986 | ↑18% | 54,887 | 4554 | 4590 | 4837 | 4906 | 4142 | 4883 | 3701 | 4656 | 4731 | 4284 | 4902 | 4701 |
| 11 | Real Estate/Property | 3874 | ↑14% | 53,809 | 4212 | 4288 | 4316 | 4518 | 4277 | 4711 | 3765 | 4784 | 4963 | 4444 | 5125 | 4406 |
| 12 | Architecture/Interior Designing | 3512 | ↑39% | 53,454 | 3390 | 3478 | 4002 | 4388 | 4492 | 4779 | 4022 | 5143 | 4980 | 4503 | 5408 | 4869 |
| 13 | NGO/Social Services | 3426 | ↑9% | 50,062 | 3627 | 4293 | 4274 | 5048 | 3891 | 4685 | 3465 | 4344 | 4530 | 3750 | 4427 | 3728 |
| 14 | Banking/Financial Services/Broking | 3546 | ↓6% | 42,696 | 3822 | 3819 | 3783 | 4026 | 3269 | 3664 | 2989 | 3535 | 3506 | 3158 | 3803 | 3322 |
| 15 | IT-Software/Services | 3413 | ↑1% | 41,529 | 3573 | 3457 | 3523 | 3688 | 3111 | 3585 | 2967 | 3565 | 3531 | 3119 | 3948 | 3462 |
| 16 | Insurance | 2547 | ↑11% | 34,608 | 2530 | 2609 | 2780 | 3075 | 2858 | 3162 | 2586 | 2981 | 3010 | 2818 | 3370 | 2829 |
| 17 | Courier/Transportation/Freight | 2645 | ↓1% | 33,973 | 2835 | 2870 | 2933 | 3288 | 2785 | 3145 | 2357 | 2870 | 2791 | 2502 | 2969 | 2628 |
| 18 | Textiles/Garments/Accessories | 2272 | ↑19% | 30,445 | 2557 | 2451 | 2584 | 2747 | 2356 | 2581 | 2167 | 2680 | 2611 | 2334 | 2665 | 2712 |
| 19 | Pharma/Biotech/Clinical Research | 2253 | ↑7% | 29,866 | 2607 | 2501 | 2494 | 2666 | 2269 | 2522 | 2064 | 2594 | 2631 | 2385 | 2728 | 2405 |
| 20 | BPO/ITES | 2095 | ↑18% | 28,803 | 2314 | 2282 | 2339 | 2450 | 2332 | 2532 | 2193 | 2475 | 2460 | 2306 | 2643 | 2477 |
| 21 | FMCG/Foods/Beverage | 2082 | ↑7% | 26,728 | 2272 | 2235 | 2211 | 2224 | 2003 | 2376 | 1859 | 2349 | 2321 | 2146 | 2514 | 2218 |
| 22 | Hotels/Restaurants/Travel | 1718 | ↑21% | 24,900 | 1971 | 1939 | 1982 | 2139 | 1992 | 2086 | 1846 | 2268 | 2272 | 2040 | 2292 | 2073 |
| 23 | Electricals / Switchgears | 1973 | ↓5% | 24,663 | 2192 | 2048 | 2095 | 2239 | 1979 | 2195 | 1607 | 2183 | 2239 | 1886 | 2128 | 1872 |
| 24 | Chemicals/PetroChem/Plastic | 1641 | ↑10% | 22,735 | 1937 | 1974 | 1971 | 2082 | 1802 | 1935 | 1585 | 1973 | 1937 | 1739 | 1988 | 1812 |
| 25 | Mining | 1377 | ↑22% | 21,141 | 1787 | 1759 | 1692 | 1984 | 1568 | 1826 | 1534 | 1744 | 2019 | 1648 | 1896 | 1684 |
| 26 | Steel | 1627 | ↑1% | 20,785 | 1879 | 1838 | 1817 | 1898 | 1707 | 1813 | 1538 | 1717 | 1676 | 1549 | 1710 | 1643 |
| 27 | Industrial Products | 1546 | ↑8% | 19,990 | 1720 | 1622 | 1708 | 1849 | 1616 | 1715 | 1331 | 1730 | 1717 | 1561 | 1754 | 1667 |
| 28 | Medical Devices / Equipments | 1459 | ↑19% | 19,789 | 1641 | 1662 | 1821 | 1669 | 1519 | 1745 | 1414 | 1679 | 1724 | 1519 | 1662 | 1734 |
| 29 | Retail | 1429 | ↑8% | 19,141 | 1635 | 1577 | 1641 | 1712 | 1466 | 1656 | 1385 | 1611 | 1603 | 1558 | 1759 | 1538 |
| 30 | Water Treatment / Waste Management | 1397 | ↑21% | 18,941 | 1624 | 1591 | 1647 | 1627 | 1464 | 1622 | 1252 | 1596 | 1743 | 1422 | 1664 | 1689 |
| 31 | Security/Law Enforcement | 1321 | ↑4% | 18,919 | 1428 | 1483 | 1778 | 1979 | 1862 | 1885 | 1320 | 1544 | 1650 | 1234 | 1383 | 1373 |
| 32 | Other | 1226 | ↑36% | 18,375 | 1389 | 1408 | 1487 | 1622 | 1346 | 1612 | 1252 | 1661 | 1643 | 1522 | 1761 | 1672 |
| 33 | Food Processing | 1293 | ↑12% | 17,736 | 1502 | 1547 | 1502 | 1620 | 1439 | 1550 | 1229 | 1529 | 1492 | 1354 | 1530 | 1442 |
| 34 | Wellness / Fitness / Sports / Beauty | 1238 | ↑24% | 17,593 | 1399 | 1428 | 1422 | 1518 | 1371 | 1599 | 1331 | 1587 | 1507 | 1389 | 1507 | 1535 |
| 35 | Printing/Packaging | 1275 | ↑2% | 16,780 | 1494 | 1375 | 1426 | 1638 | 1335 | 1420 | 1098 | 1423 | 1541 | 1294 | 1438 | 1298 |
| 36 | Facility Management | 1281 | ↑2% | 16,139 | 1464 | 1412 | 1429 | 1359 | 1134 | 1259 | 1088 | 1364 | 1377 | 1335 | 1617 | 1301 |
| 37 | Construction/Engineering | 1168 | ↑13% | 15,837 | 1344 | 1284 | 1306 | 1369 | 1207 | 1329 | 1092 | 1377 | 1430 | 1262 | 1513 | 1324 |
| 38 | Auto/Auto Ancillary | 1239 | ↓0% | 15,367 | 1310 | 1296 | 1324 | 1446 | 1222 | 1349 | 1066 | 1306 | 1290 | 1149 | 1371 | 1238 |
| 39 | Export/Import | 1313 | ↓17% | 15,289 | 1347 | 1279 | 1348 | 1478 | 1269 | 1354 | 1044 | 1372 | 1263 | 1151 | 1298 | 1086 |
| 40 | Publishing | 1112 | ↑13% | 14,998 | 1265 | 1236 | 1250 | 1383 | 1138 | 1253 | 1039 | 1275 | 1344 | 1179 | 1380 | 1256 |
| 41 | Agriculture/Dairy | 1105 | ↑13% | 14,886 | 1321 | 1248 | 1233 | 1207 | 1166 | 1344 | 1066 | 1310 | 1271 | 1128 | 1343 | 1249 |
| 42 | Strategy /Management Consulting Firms | 1119 | ↑2% | 13,486 | 1093 | 1017 | 1104 | 1179 | 1017 | 1208 | 928 | 1211 | 1218 | 1050 | 1315 | 1146 |
| 43 | Aviation / Aerospace Firms | 1042 | ↑0% | 13,140 | 1100 | 1192 | 1049 | 1259 | 861 | 1113 | 797 | 1143 | 1348 | 1093 | 1142 | 1043 |
| 44 | KPO / Research /Analytics | 1080 | ↓9% | 12,741 | 1114 | 1094 | 1134 | 1111 | 999 | 1207 | 981 | 1083 | 1044 | 904 | 1090 | 980 |
| 45 | Shipping/Marine | 1077 | ↓13% | 12,197 | 1107 | 1032 | 1114 | 1183 | 944 | 1031 | 864 | 947 | 1025 | 855 | 1157 | 938 |
| 46 | Consumer Durables | 899 | ↑5% | 11,615 | 1101 | 1002 | 1085 | 1221 | 868 | 904 | 732 | 940 | 1006 | 863 | 951 | 942 |
| 47 | Internet/Ecommerce | 879 | ↓8% | 10,688 | 944 | 968 | 910 | 984 | 878 | 953 | 762 | 890 | 855 | 814 | 924 | 806 |
| 48 | Oil and Gas/Energy | 665 | ↑15% | 9,411 | 789 | 797 | 813 | 851 | 717 | 766 | 628 | 779 | 866 | 759 | 878 | 768 |
| 49 | Recruitment | 662 | ↑44% | 8,480 | 666 | 685 | 699 | 703 | 484 | 545 | 502 | 681 | 876 | 762 | 923 | 954 |
| 50 | IT-Hardware & Networking | 596 | ↑11% | 7,370 | 615 | 618 | 621 | 660 | 510 | 580 | 519 | 647 | 689 | 557 | 694 | 660 |
| 51 | Media/Dotcom/Entertainment | 464 | ↑13% | 6,303 | 493 | 560 | 492 | 566 | 514 | 547 | 437 | 565 | 539 | 497 | 570 | 523 |
| 52 | Telcom/ISP | 437 | ↓3% | 5,276 | 474 | 467 | 459 | 451 | 413 | 508 | 367 | 453 | 437 | 374 | 450 | 423 |
| | Total hiring | | | 1,668,241 | via Naukri Portal in 2025 - 2026 | | | | |
| | Info Edge revenue | | | 33,520,000,000 | | | | | | | | | | | | |
| | Per hire cost | 3352 | Rs. | 20,093 | | | | | | | | | | | | 3 |
| | Three Jump | 10000000 | 60,279 | | | | | | | | | | | | |
FY2024 (April 2023 – March 2024)
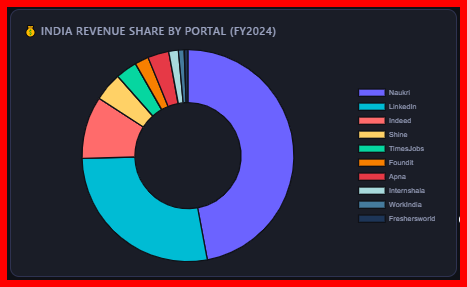
Combined Portal Revenue (India, est.) FY2024: ₹3,850 Cr
Naukri.com Market Share India online recruitment: 62%
Portal-wise Revenue, Users Volume & Efficiency (FY2024)
| Portal-wise Revenue, Users Volume & Efficiency (FY2024) |
| # | Portal | Parent Company | India Revenue (FY24) | Revenue Source | Est. Users (India) | Efficiency Rating | Segment Focus |
| 1 | Naukri.com | Info Edge India | ₹1,880 Cr | Audited Annual Report | 99 Mn registered; 87 Mn active | ★★★★★ Excellent | Mid–Senior, All Sectors |
| 2 | LinkedIn (India) | Microsoft | ~₹1,100 Cr* | Est. (8% of global revenue) | 130 Mn members | ★★★★☆ Good | Senior, Tech, Networking |
| 3 | Indeed India | Recruit Holdings | ~₹380 Cr* | Est. (India ~4% global rev.) | 50 Mn+ users | ★★★★★ Excellent | Entry–Mid, High Volume |
| 4 | Shine.com | HT Media (Hindustan Times) | ~₹175 Cr* | Est. (HT Media digital seg.) | 45 Mn registered | ★★★☆☆ Average | IT, BFSI, BPO, Mid-level |
| 5 | TimesJobs | Times Internet (Times Group) | ~₹130 Cr* | Est. (market share proxy) | 30 Mn registered | ★★★☆☆ Average | IT, Engineering, Healthcare |
| 6 | Foundit (ex-Monster) | Quess Corp | ~₹85 Cr* | Est. (post-rebranding) | 40 Mn registered | ★★★☆☆ Average | Tech, Startups, SMEs |
| 7 | Apna | Apnatime Tech Pvt Ltd | ₹128 Cr | MCA/RoC Filing | 60 Mn users; 7 Lakh employers | ★★★☆☆ Average | Blue/Grey Collar, Entry-level |
| 8 | Internshala | Scholiverse Educare | ~₹60 Cr* | Est. | 21 Mn candidates | ★★★★☆ Good | Freshers, Interns, Campus |
| 9 | WorkIndia | WorkIndia Pvt Ltd | ~₹35 Cr* | Est. | 15 Mn+ workers | ★☆☆☆☆ Worst | Blue Collar, Field Staff |
| 10 | Freshersworld | Freshersworld.com | ~₹22 Cr* | Est. | 15 Mn registered | ★★★★☆ Good | Freshers, Campus |
* Estimated. Entries without an "Audited" badge are estimates derived from traffic-share data, employer-count proxies, and industry cost benchmarks.
Verified Revenue:
Naukri/Info Edge — FY24 Audited Annual Report (₹1,880 Cr recruitment segment); Apna — MCA/RoC filing (₹127.6 Cr operating revenue, FY24).
Estimated Revenue:
LinkedIn India estimated at ~8% of global FY24 revenue ($17.1B × 8% ÷ 84 = ₹~1,100 Cr), based on India being ~8% of global LinkedIn traffic and ~13% of users.
Indeed India estimated at ~4% of global HR Solutions revenue (Recruit Holdings FY24).
Shine, TimesJobs, Foundit, Internshala, WorkIndia, Freshersworld estimated from market-share proxies and employer-pricing models.
Sources include: Info Edge Annual Report FY24, Entrackr, Inc42, YourStory, Cutshort.io market survey, CutShort India Recruitment Report, LinkedIn Statistics 2024 (Business of Apps), SHRM India Hiring Data.
Compiled from Public Financial Disclosures & Market Research.
Important: Figures above use verified revenue data (from annual reports/filings) combined with industry-standard conversion ratios and market share estimates. Where revenue is India-only unavailable, proportional estimates (based on traffic/user share) are used.